
Additional Pictures
Date: 2002.02.22

|
|
Gas Hydrate Research Well Program Additional Pictures Date: 2002.02.22 |
|
| THUMBNAIL | NAME | REMARKS | DEPTH (m) |
|---|---|---|---|
|
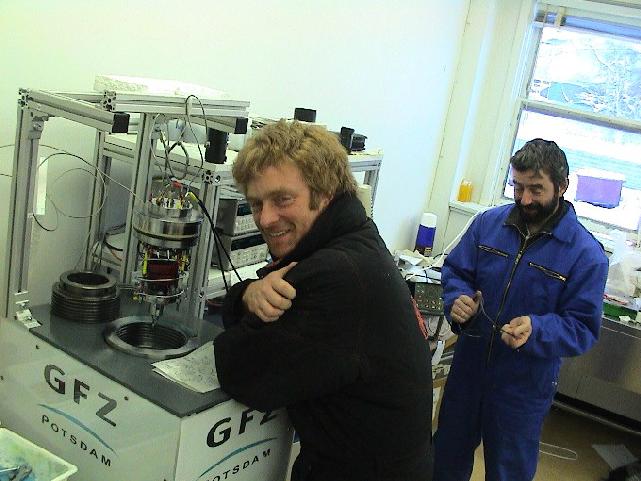
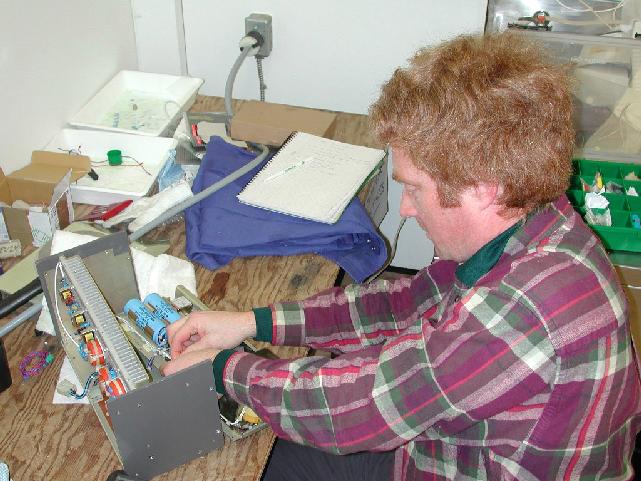
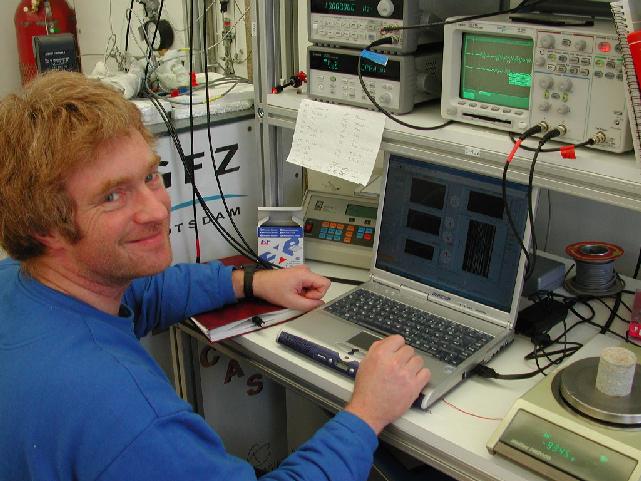
UN_flecas_1.jpg | Erik Spangenberg and Johannes Kulenkampff (GFZ) got their first core samples last Tuesday and start performing experiments under simulated in situ conditions. | n.a. - n.a. |
|
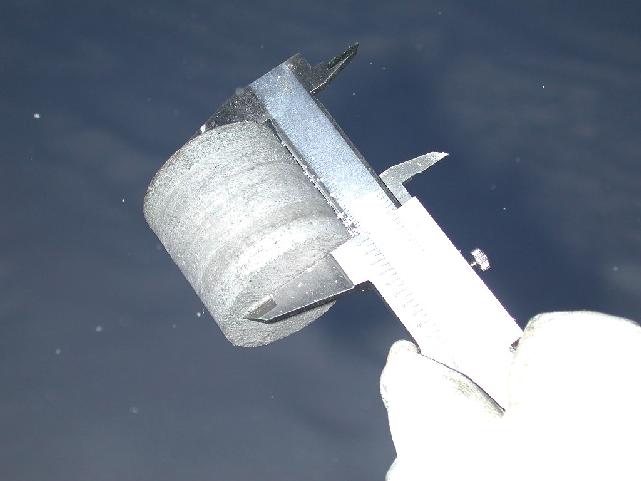
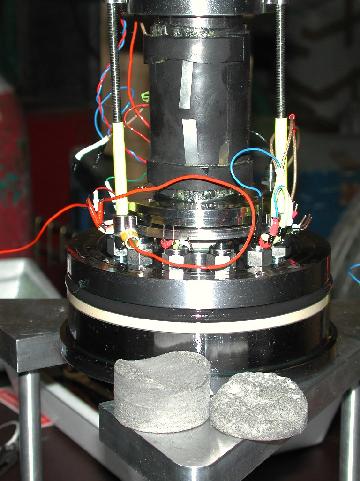
UN_flecas_2.jpg | Erik and Joe prepared 20 plugs (47mm in diameter and 50mm in length ) out of 11 core samples. | n.a. - n.a. |
|
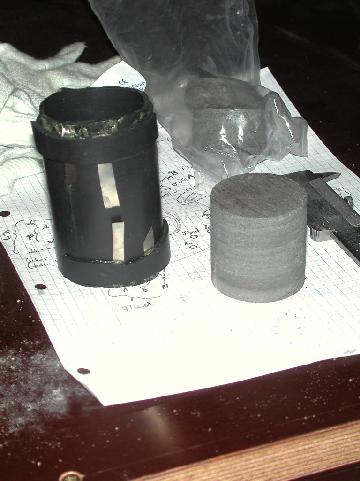
UN_flecas_3.jpg | When ever possible they tried to take one plug parallel to the core axis and one perpendicular to get information about anisotropy. | n.a. - n.a. |
|
UN_flecas_4.jpg | To date Erik and Joe measured 12 samples with varying hydrate content from the depth interval between 892m and 1088m. | n.a. - n.a. |
|
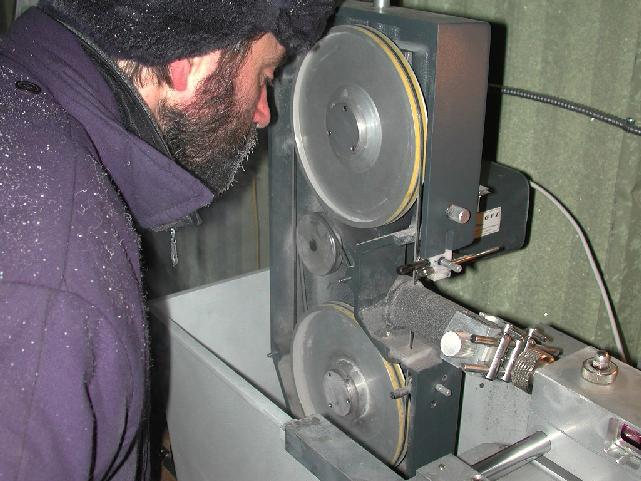
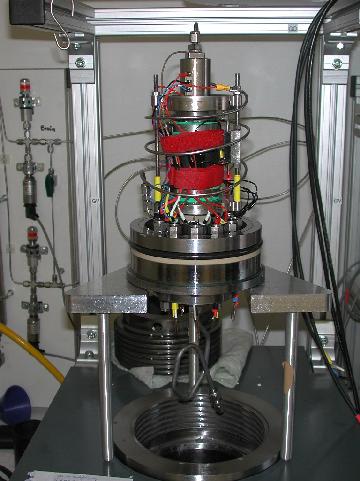
UN_flecas_5.jpg | Although the power amplifier brokes down, Erik and Joe where able to get good p-wave signals and for some samples also good s-wave signals. | n.a. - n.a. |
|
UN_flecas_6.jpg | The measurements of electrical resistivity worked very well for all samples measured so far. | n.a. - n.a. |
|
UN_flecas_7.jpg | Both parameters have been measured in dependence of temperature from about -10 Celsius to in situ formation temperature. | n.a. - n.a. |
|
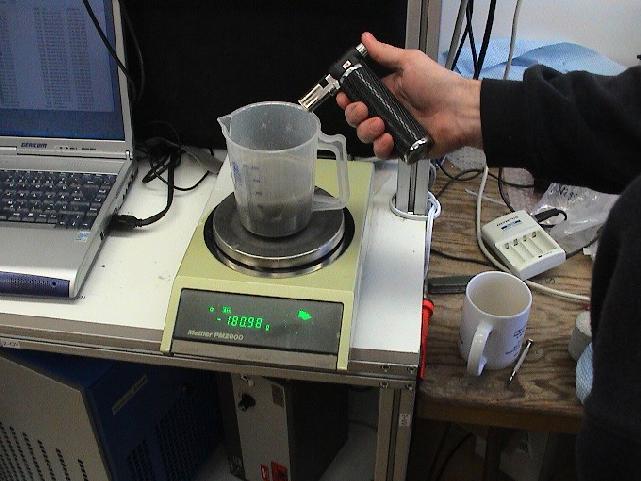
UN_flecas_8.jpg | With the exception of two samples, we where able to extract between 1 and 7 ml of pore water samples before and after the hydrate dissociation. | n.a. - n.a. |
|
UN_flecas_9.jpg | The chemical analysis of the pore water will support the interpretation of the collected resistivity data. | n.a. - n.a. |